

The road not taken – exploring ‘what if?’ with causal analytics

As organisations increasingly focus on measuring the outcomes of their decisions, recent developments in causal analytics are helping decision-makers evaluate the decisions they have made in the past to improve the decisions they will make in the future.
In 2022, the electronics manufacturer Hisense sponsored the FIFA World Cup and invested a significant amount in getting the Hisense brand associated with the massive global event. Naturally, Hisense would want to quantify the return on investment in the form of brand awareness and sales.
Measuring impact can be complex
With the increasing availability of large amounts of data, organisations like Hisense have become more aware of the competitive advantages of measuring the impact of marketing campaigns – but the world of marketing is diverse and complex. The impacts of routine direct marketing activities through owned channels, such as direct-marketing email campaigns, can be easily tracked with well-established statistical methods. The effect of broader based campaigns, such as mass media campaigns across an entire country or the world (like sponsoring the FIFA World Cup), are much more difficult to attribute back to the marketing.
Seeing the unseen
The crux of this challenge lies with identifying a ‘what if?’ world, where you can see what would have happened if a marketing intervention was not implemented. In the case of direct marketing, this can be done with carefully constructed control groups.
But what do we do when it’s not possible to construct matched controls, as in Hisense’s case? Establishing the business benefit from its investment decision is inherently difficult, as it requires comparison to a scenario which did not occur – one where Hisense chose not to sponsor the World Cup.
The question of ‘what if?’ lies at the heart of evaluating the impact of most high-cost, high-risk decisions. What if we had decided not to proceed with this marketing campaign? What if we had decided not to enact this government policy?

Causal analytics help to capture the impacts of major campaigns, like sponsoring the FIFA World Cup
Lifting the veil on ‘what if?’
Recently, advances in the field of causal analysis are lifting the veil on ‘what if?’. We can now take a peek at alternate counterfactual scenarios, even where direct controls are not possible, helping us to put firmer estimates on the returns from broad-based marketing activities. Advanced analytics is allowing us to explore the road not taken.
For Hisense, this means we can reasonably answer questions such as Can we see evidence of the effect of its near-blanket coverage across the largest sporting event in the world on brand sentiment? How large was the effect? Did the effect persist beyond the World Cup and, if so, for how long?
Understanding what would have happened
If determining the impact, or causal effect, of a decision requires us to understand what would have happened in the absence of that decision, we can do this by calculating a ‘treatment effect’. This is defined as a comparison between the outcomes of a group impacted by an intervention (for example a marketing campaign) compared to the outcomes in a control group with no intervention.
In some scenarios, a ‘randomised controlled trial’ (RCT), can help determine a treatment effect. In an RCT, a random selection of participants receives the intervention (the treatment group) while other participants do not (the control group). Because the allocation of the intervention is random, it can be reasonably asserted that the difference in the outcomes between the treatment and control groups is mostly due to the intervention, and not due to other ‘confounding’ factors.
However, there are many scenarios where an RCT is not applicable. Sometimes, defining a treatment and control group could be unethical, for example in instituting government policy. In other situations, it might simply be impossible. Hisense cannot designate a control group for its World Cup sponsorship as it is a global event watched by a significant proportion of the world population.
How ‘mental availability’ offers the first clues
A plausible first step to finding answers is to identify and measure proxies for ‘mental availability’. This refers to a brand coming to mind as a potential customer considers a purchase.
A credible proxy for this measure is the level of search interest on Google, where we assume consumers actively searching for a brand reflects mental availability. Google search statistics are available for any topic and any region through the Google Trends service. In the graph below, we show the worldwide Trends data for the search term ‘Hisense’ from January 2021 to March of 2023.
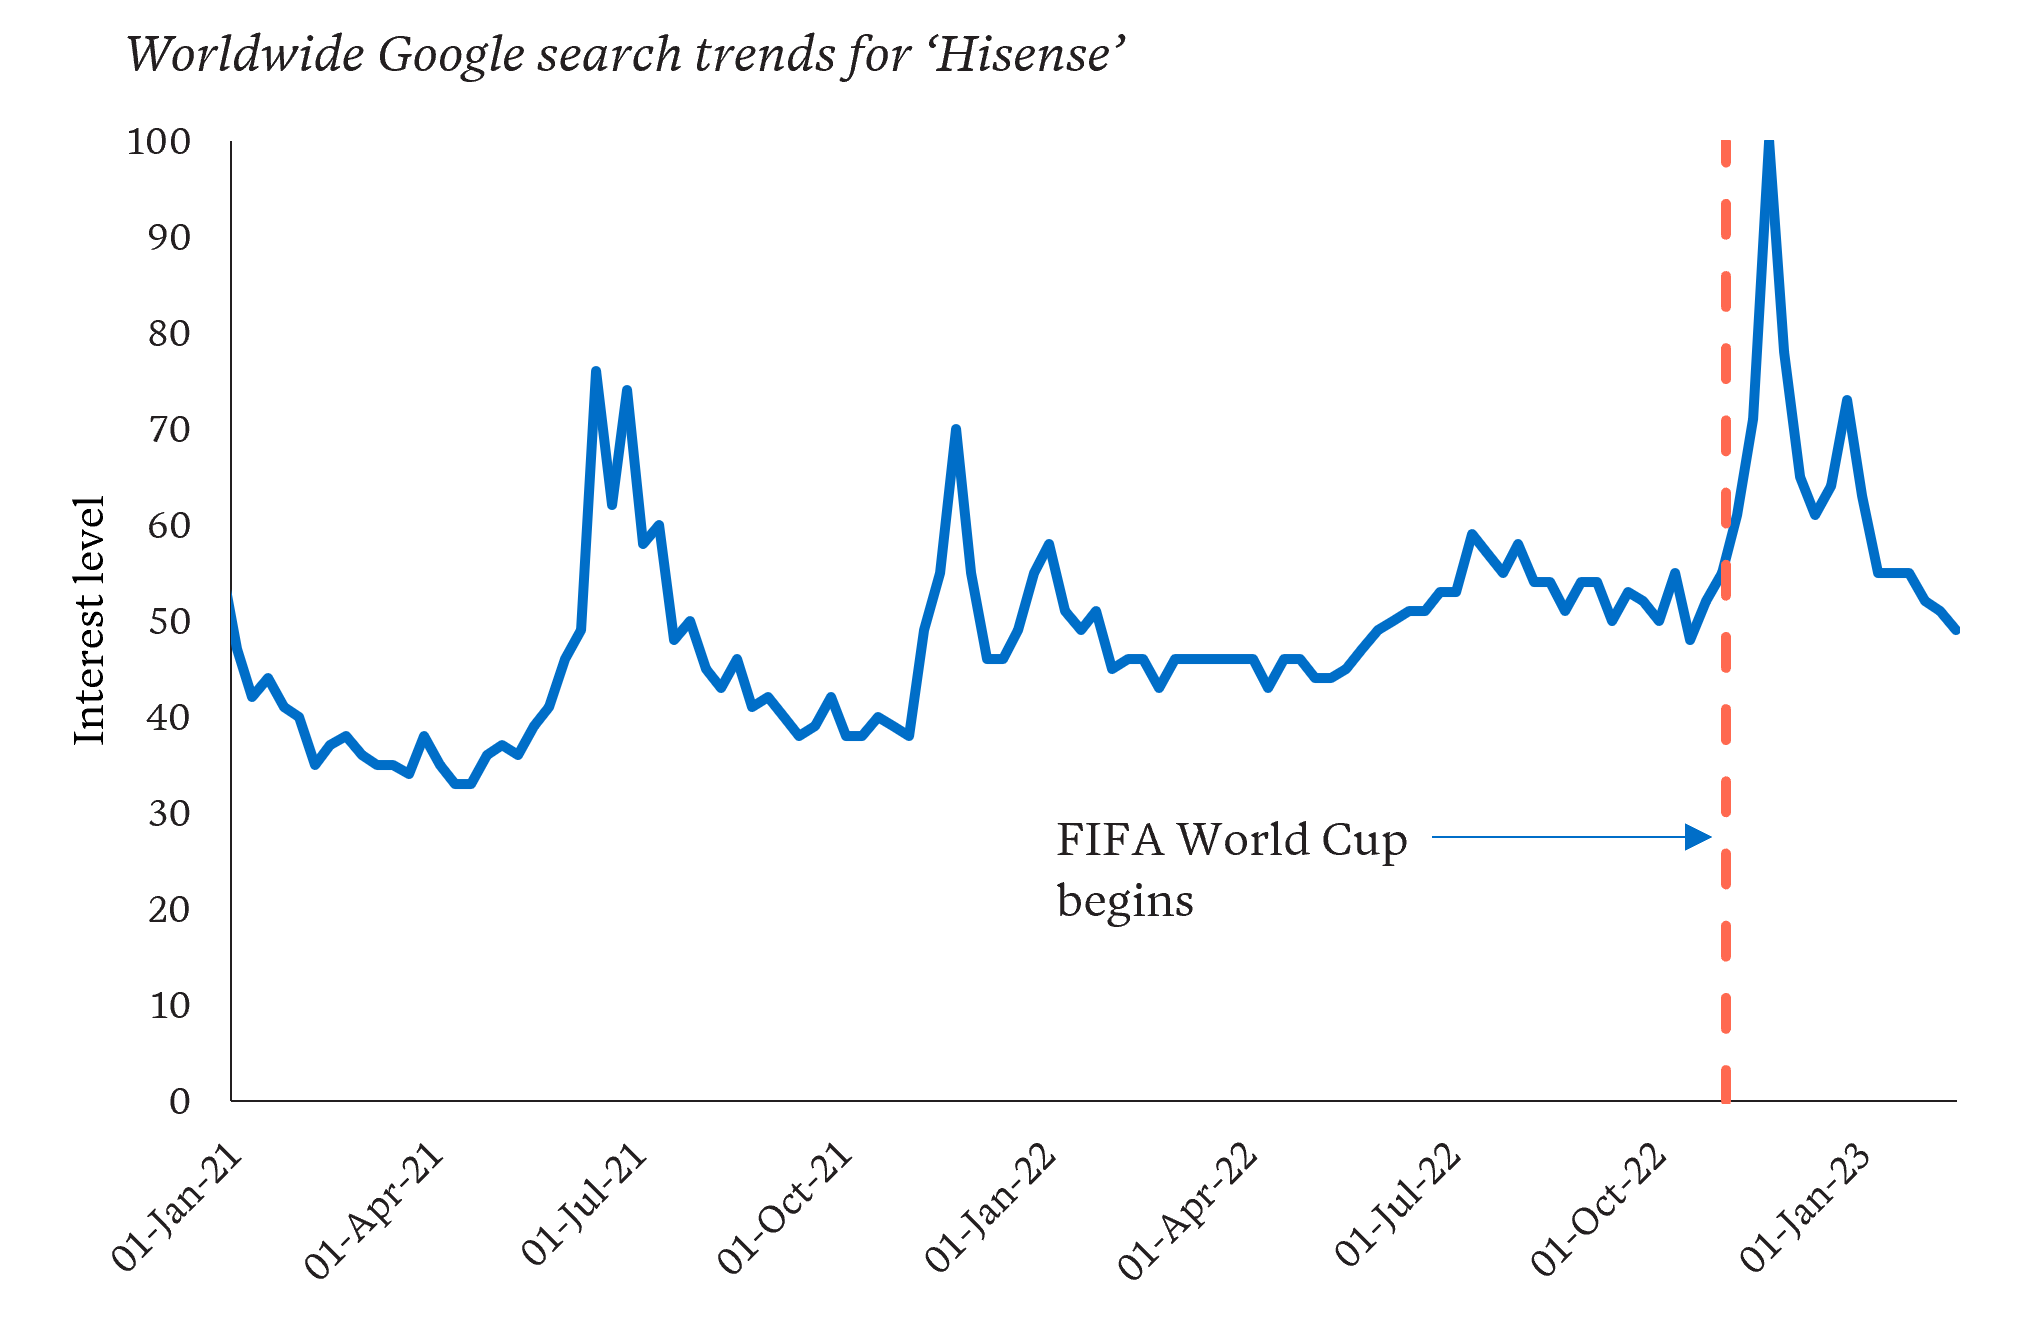
How can we tell if the surge in interest is due to the World Cup? A synthetic control holds the key
It is apparent that Hisense had a large increase in Google search activity in the period around the World Cup in November of 2022, but this coincides with another large event in the marketing calendar – Black Friday on 25 November. Moreover, we can see several surges in interest in previous time periods. What caused these surges? Is the post-World Cup increase a direct, causal outcome of the World Cup? Or is it just part of the normal rhythms of the universal sales calendar, such as Black Friday and Christmas sales? To answer these questions, and in the absence of a ‘matched’ control, we need a robust ‘representative’ baseline control – enter the synthetic control.
The synthetic control – something out of nothing
If it is not feasible to have a real life, ‘organic’ control, then one possible solution is to have an artificially constructed post-hoc ‘synthetic’ control. Synthetic controls approximate a real control by piecing together information from other similar groups not impacted by the intervention.
For example, it is plausible that the brand awareness of Hisense at any given time could be approximated by taking a weighted sum of the brand awareness of other similar competitor brands. And, further, given no competitors sponsored the World Cup, it could then be possible to simulate an alternate reality where Hisense also did not sponsor the World Cup.
Kicking goals with Structural Time Series
An analytical technique that has received recent prominence for tackling this problem is the Bayesian Structural Time Series model. These models are highly customisable and can ingest a variety of different factors to approximate a time series, including trends, seasonal effects and dependent variables.
The significant advantage that Bayesian Structural models have over other time series modelling techniques is that they are explainable, predominantly for two reasons. Firstly, because they are made up of constituent ‘building blocks’, it is easy to understand the underlying dynamics of how the observation is changing over time. Secondly, they inherently generate an estimation of uncertainty, which gives a measure of how confident you should be in the prediction.
We can extract search trends for several electronics retailers, including Samsung, Sony and LG, to be used to create the synthetic control. The general movements of the curves are in good alignment in the pre-World Cup period – when the interest levels of a brand rise typically the interest levels of the other brands also rise. This suggests that the competitor brands are good candidates to be used as building blocks in the Bayesian Structural models.
Extracting trends for similar brands helps us better attribute the surge in interest for Hisense
Applying the Bayesian Structural Time Series technique1,2 to the Google search data for the competitor brands yields a synthetic control for Hisense interest levels. In addition to an overall predicted synthetic control, the algorithm also produces representations of the building blocks or components, which we illustrate below.
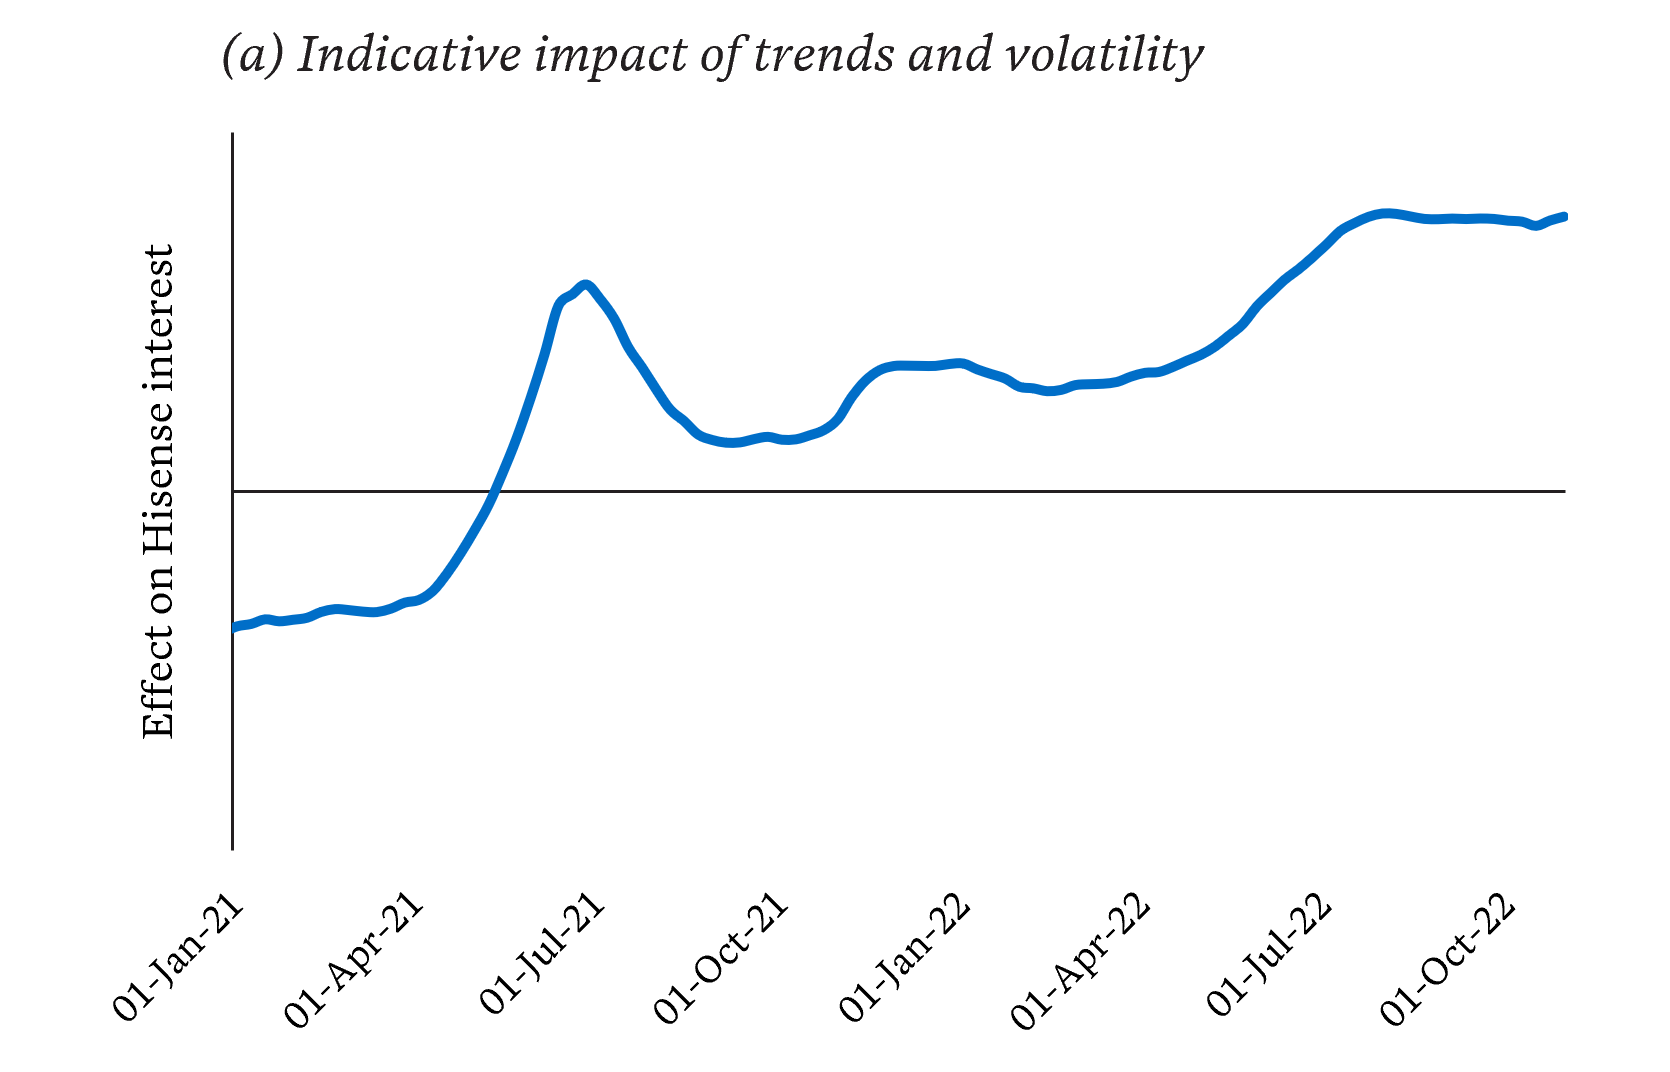
This shows rising interest in Hisense in addition to effects not captured by the comparison brands
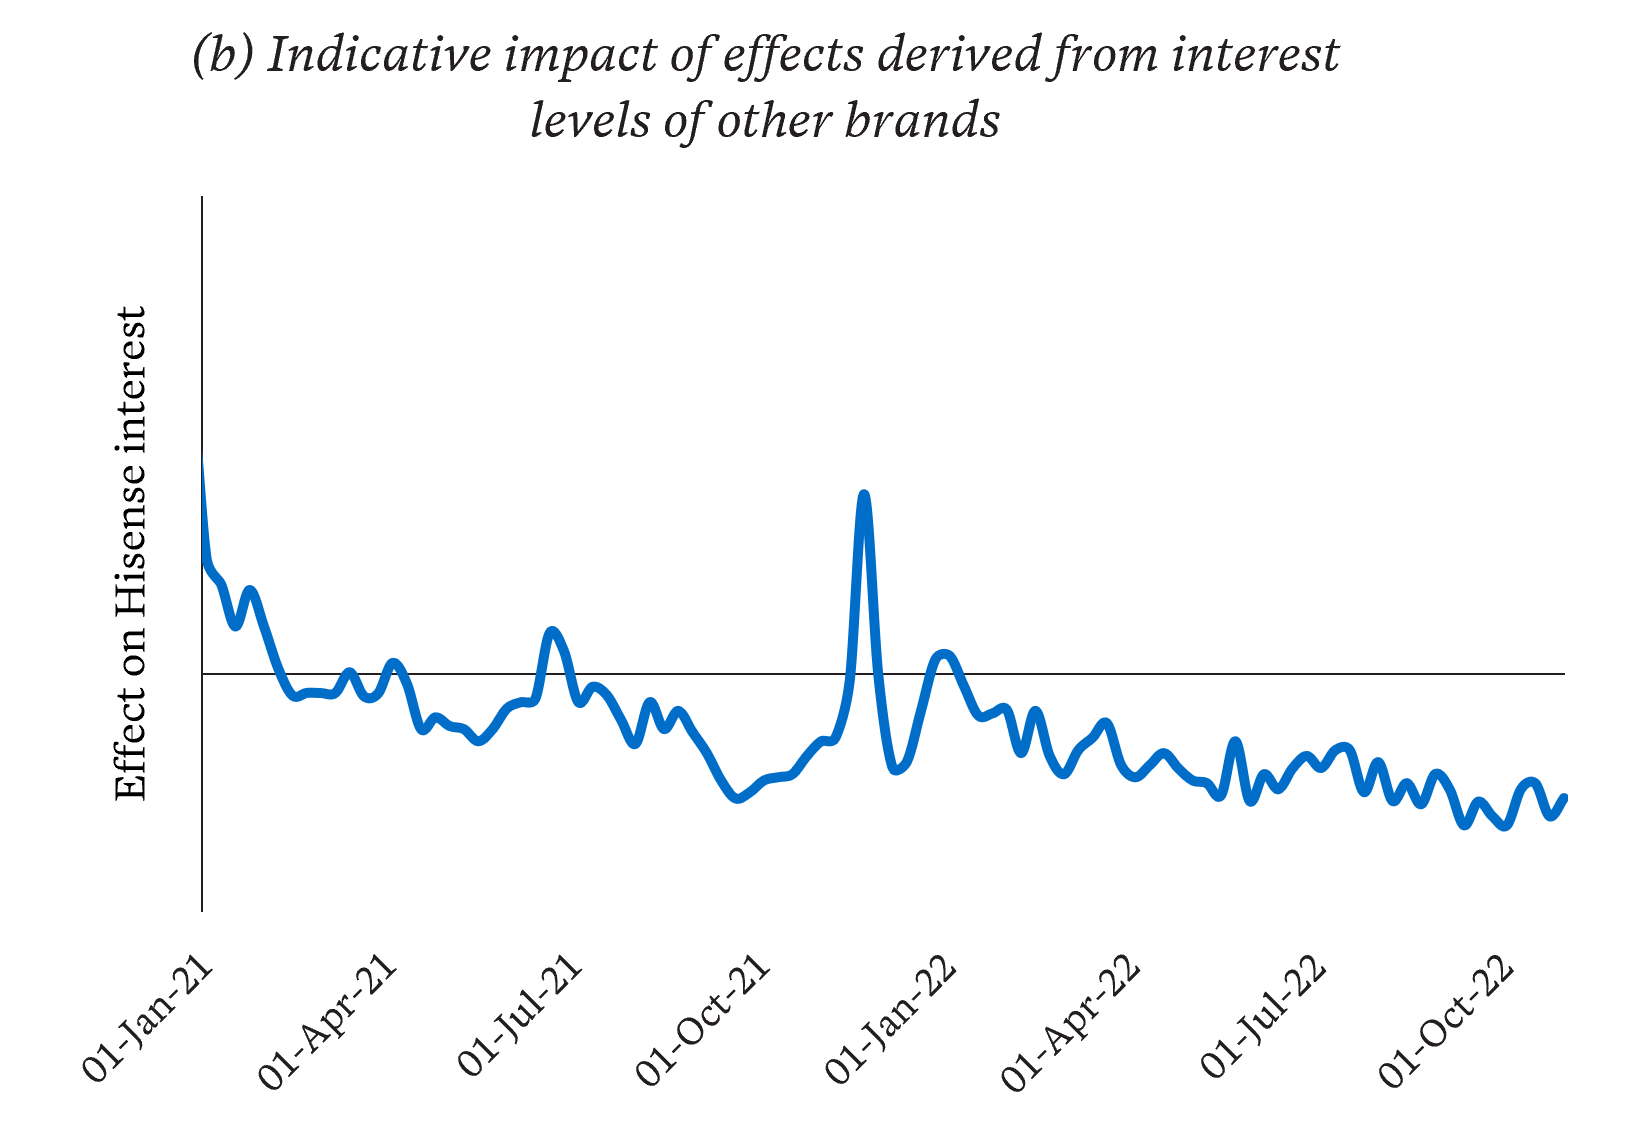
Effects from interest levels of other brands. Together (a) and (b) create our synthetic control
The first component (a) represents the trends and natural volatility in the Hisense interest levels. This captures the general increasing trend in the Google search interest of Hisense over time in addition to any volatile effects that are not captured by the interest levels in the other brands. The second component (b) represents the effects that can be extracted from the interest levels of other brands, including seasonal sales, general consumer sentiment, consumer expos and more. These two curves are blended to create the overall predicted synthetic control curve.
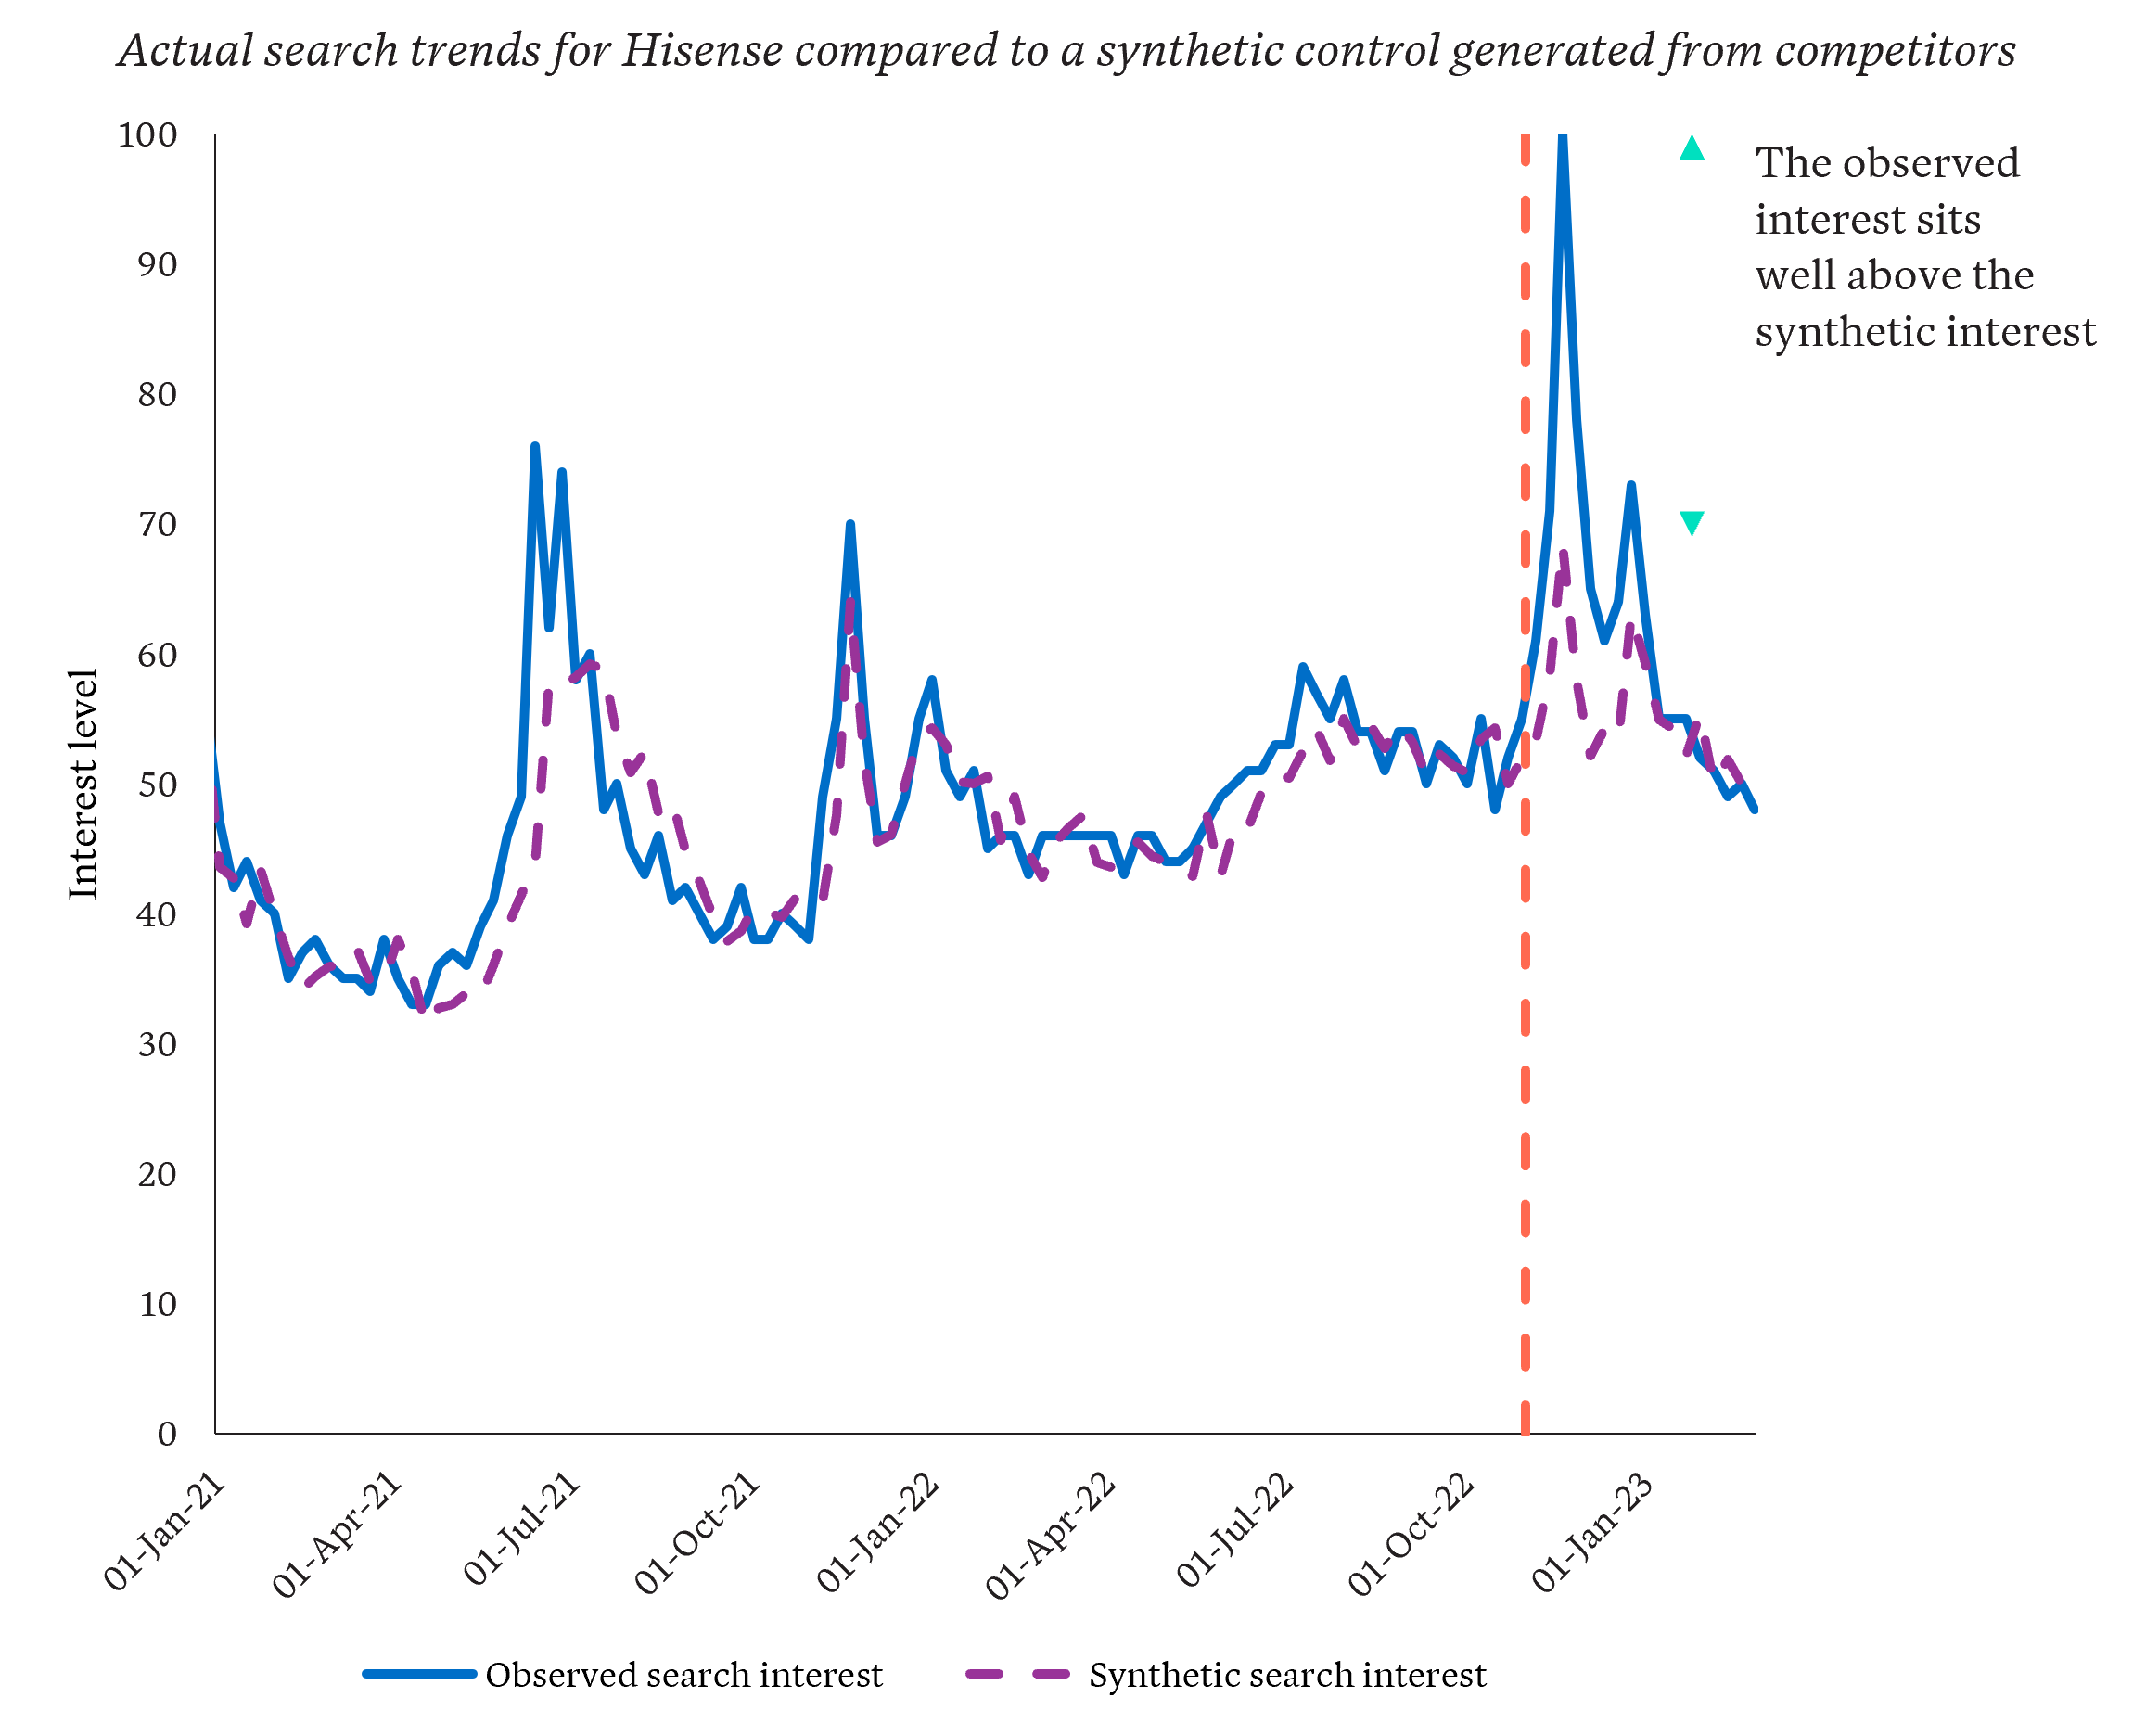
Big sponsorship impact, shown by actual interest levels above synthetic levels after the World Cup
The trend estimates from the model approximates the real Hisense Google interest reasonably accurately before the World Cup, even in times of disruption like Black Friday of 2021. This gives some comfort that the synthetic control will appropriately simulate the alternate reality where Hisense did not sponsor the World Cup.
Comparing the synthetic control and actual search data yields interesting results. Clearly the actual interest levels are well above the synthetic interest levels following the World Cup – indicating a strong impact from the sponsorship. Overall, across the World Cup period, the middle estimate of the change in search interest of the Hisense brand on Google is a healthy increase of 22%.
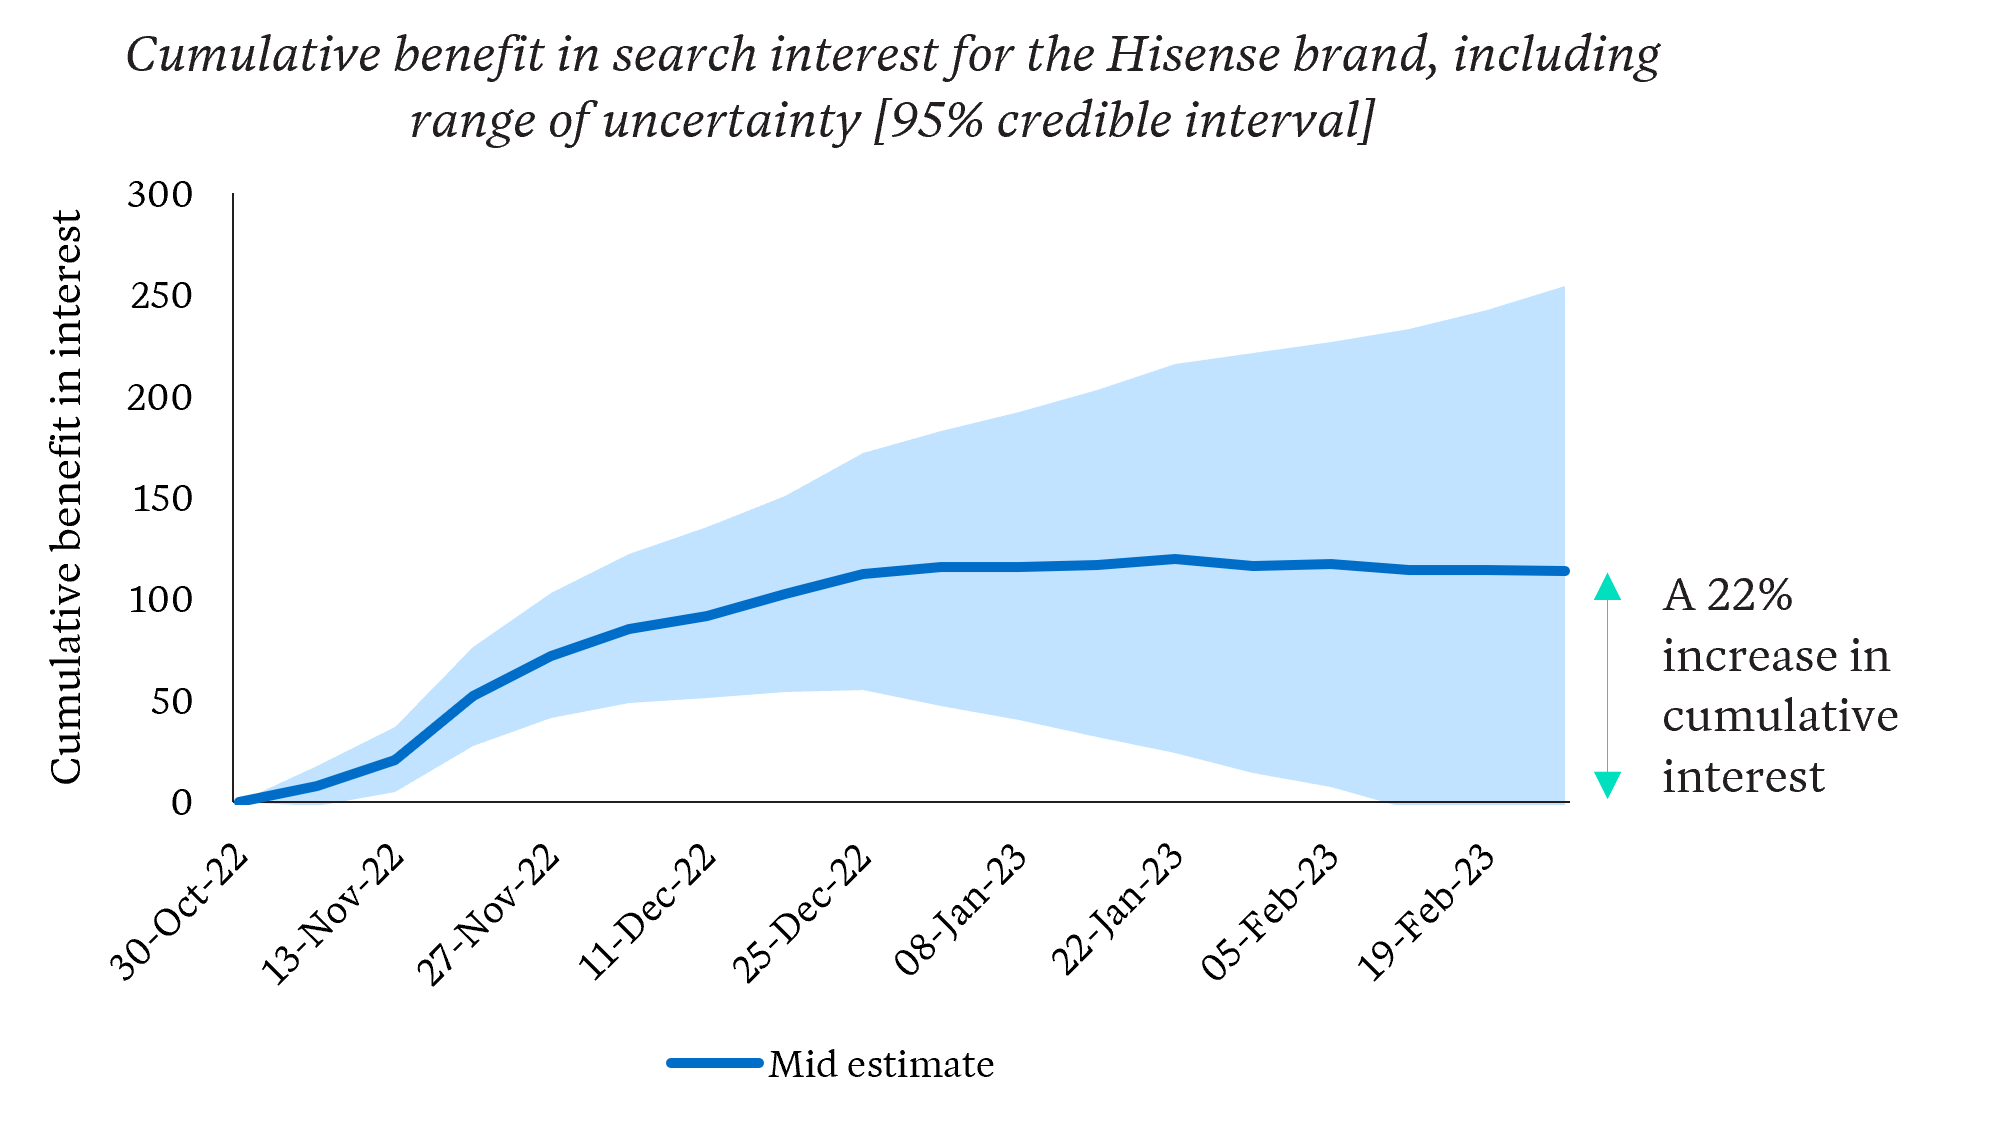
Overall, the change in interest for Hisense across the World Cup period is a healthy 22% increase
The cumulative benefit increases rapidly at first, coinciding with the initial excitement of the opening games of the tournament, and then begins to tail off as the festivities draw to a close, eventually falling back to the baseline in January 2023. The return to the baseline poses an important question: is the increased brand awareness in Hisense transient or is it long lasting? At first glance, it appears to be transient, but a longer observational period into the future is required to assess properly. Clearly, assessing the long-term impact of the sponsorship is vital to assessing value for money.
A force for good
Causal analysis is a rapidly evolving area, with new developments in the field being discussed in earnest within the analytics community. Although much of the new interest has been driven by a greater desire within the corporate world to understand the impact of business decisions, understanding causal relationships is also vitally important in evaluating public policy.
Synthetic controls have proven especially useful in the government space – so much so that the technique has been described as “arguably the most important innovation in public policy literature in the last 15 years” by 2021 Nobel laureate Professor Guido W. Imbens and causal analysis expert Professor Susan Athey3.
Ultimately, exploring the road not taken – those ‘what if?’ scenarios – is an enormous step towards making better decisions –in terms of bolstering the benefits in business and improving outcomes for members of the community. And this is just the beginning. There is much potential to achieve this complementary effect across many industries to make a difference now and well into the future.
Citations
- Brodersen, K.H., Gallusser, F., Koehler, J., Remy, N. and Scott, S.L., 2015. Inferring causal impact using Bayesian structural time-series models.The Annals of Applied Statistics, pp.247-274.
- Causal Impact 1.3.0, Brodersen et al., Annals of Applied Statistics (2015). https://google.github.io/CausalImpact/
- Athey, Susan, and Guide W. Imbens. 2017a. “The State of Applied Econometrics: Causality and Policy Evaluation.” Journal of Economic Perspectives 31 (2): 3–32.
Related articles
Related articles
More articles

How AI is transforming insurance
We break down where AI is making a difference in insurance, all the biggest developments we’re seeing and what's next for insurers
Read Article

Where are the businesses most reliant on JobKeeper (January)?
Our interactive map shows the proportion of businesses receiving JobKeeper by local government area from April 2020 to January 2021
Read Article