


Modelling Victoria’s second wave of COVID-19 cases

Last month, we looked back at the trajectory of COVID-19 in Victoria, modelling the second wave of COVID-19 cases to see how effective various restrictions were at slowing the spread of the disease. Since then, the Victorian Government has introduced several additional restrictions. In this article, we use the same modelling techniques to take a retrospective look at how effective these restrictions have been.
In our initial analysis, we looked at COVID-19 infection data in Victoria up to 3 August. This meant we were able to estimate the impact of the various restrictions put in place in June and July, including:
- Restrictions on family gatherings towards the end of June
- Progressive lockdowns on 2 and 9 July
- Introduction of mandatory facemasks on 23 July
We found each introduced measure did lead to a reduction in the transmission rate of COVID-19. However, after the introduction of mandatory facemasks the transmission rate was balanced on a knife’s edge – while the epidemic was under control, without further measures the number of new cases would not have reduced.
Of course, there were further measures – the full metropolitan lockdown on 2 August and the regional and business measures on 6 August, and there was some evidence at the time that a turning point might have been reached.
Now, over a month later, no modelling is necessary to see that, indeed, the peak in cases occurred in late July/early August and has been declining since, with levels over the last few days similar to those seen back in June. The strict conditions endured by Victorians, those in Melbourne in particular, have paid off in a significantly decreased disease incidence.
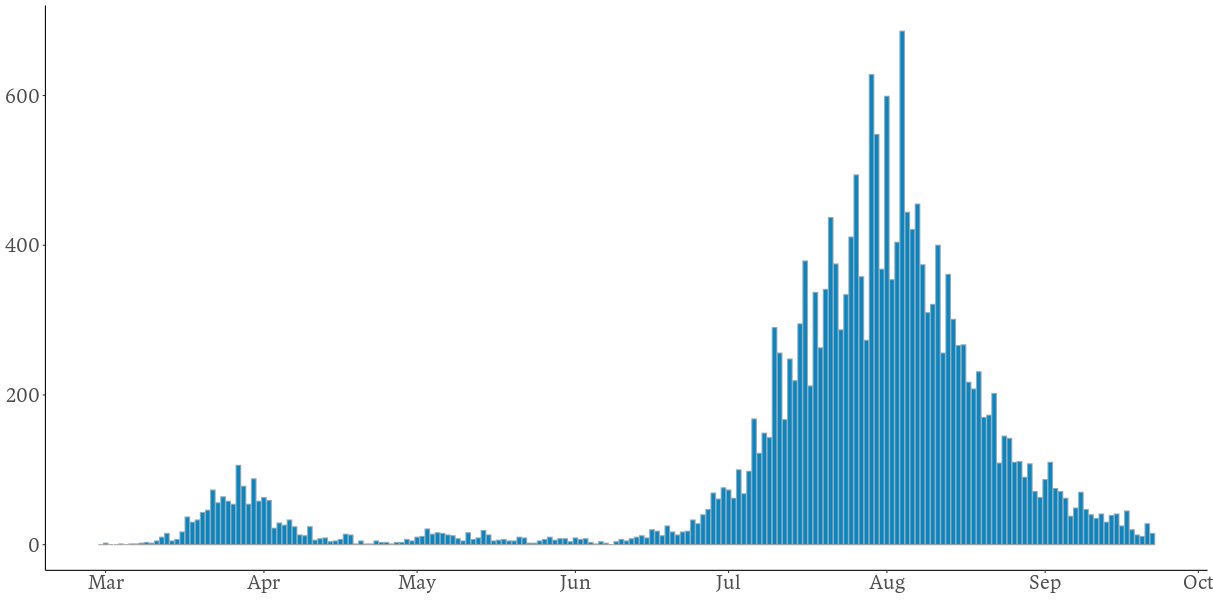
Daily reported cases of COVID-19 in Victoria
We’ve rerun our analysis (based on that used by German researchers – Dehning et al – to measure the impact of measures at different points in time), focusing on answering the following questions:
- With updated data (the Department of Health and Human Services in Victoria makes retrospective changes to data as more information comes to light about each case), do we still estimate an Reff of 1 after the introduction of mandatory facemasks?
- What was the impact of the lockdown measures on 2 and 6 August?
- What have the transmission rates been like over the past few weeks?
What did we find?
In the figure below, we plot the effective reproduction number as estimated by the model, and measure the change in the reproduction number between key dates, such as easing or re-introduction of restrictions. The effective reproduction number is a measure of how many people an infected individual can pass the disease onto, and it measures the trajectory of the disease. Reproduction numbers:
- Above 1 are indicative of a growing epidemic
- Below 1 correspond to decreasing numbers of new infections.
Effective COVID-19 control strategies reduce the reproduction number so it is below 1. When the reproduction number is 1, new cases remain at a constant level.
The figure below shows the estimated reproduction number from July onwards, with the corresponding numerical estimates shown in the table below. The model assumes that changes occur over a number of days, usually about 3 days, so the reproduction number estimated at the 23 July change point (0.99) is reached about 3 days afterwards, on 26 July. A similar delay affects the other points.
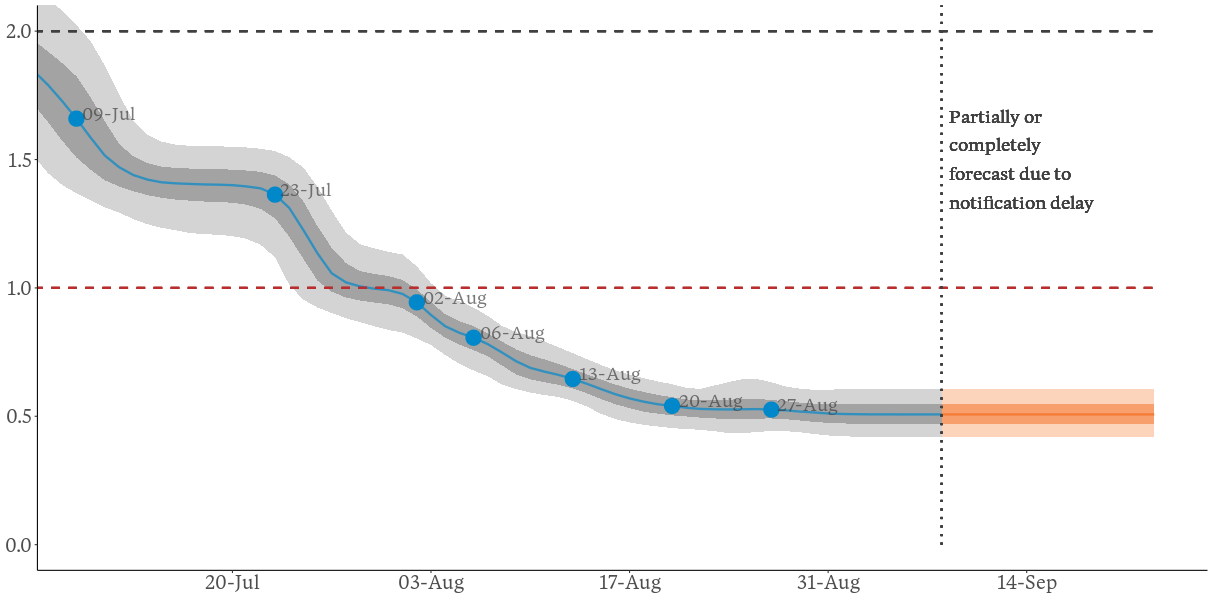
Estimated reproduction rates at key dates over June, July and August
Estimated reproduction rates at key dates over June, July and August
| Intervention date | Significance | Estimated reproduction number following the intervention |
|---|---|---|
| 9-Jul | Lockdown of Melbourne and Mitchell Shire | 1.4 |
| 23-Jul | Introduction of mandatory masks | 0.99 |
| 2-Aug | Level 4 restrictions in Melbourne | 0.81 |
| 6-Aug | Level 3 restrictions in regional Victoria and business restrictions | 0.67 |
| 13-Aug | 1 week after last intervention | 0.55 |
| 20-Aug | 2 weeks after last intervention | 0.53 |
| 27-Aug | 3 weeks after last intervention | 0.51 |
We see the answer to our questions in the figure and the table, namely there was:
- A reproduction number of essentially 1 after the introduction of mandatory facemasks on 23 July, indicating case numbers would not have reduced without further interventions
- A significant reduction in spreading rates after the introduction of Level 4 restrictions in Melbourne on 2 August
- A further significant reduction in spreading rates after the introduction of regional and business restrictions on 6 August – prior to that a significant number of infections had been acquired at work
- Some further reductions over the following 2 weeks, with the reproduction number estimated to be around 0.5 in late August.
What does this mean for future case numbers?
We’ve shown the actual and modelled case numbers below – our model used data up to 16 September so we’ve highlighted the data since then in orange. Numbers continue to trend downwards. If things stay on track, then signs are positive for Victorians, and consequently all Australians, as we head into the summer months.
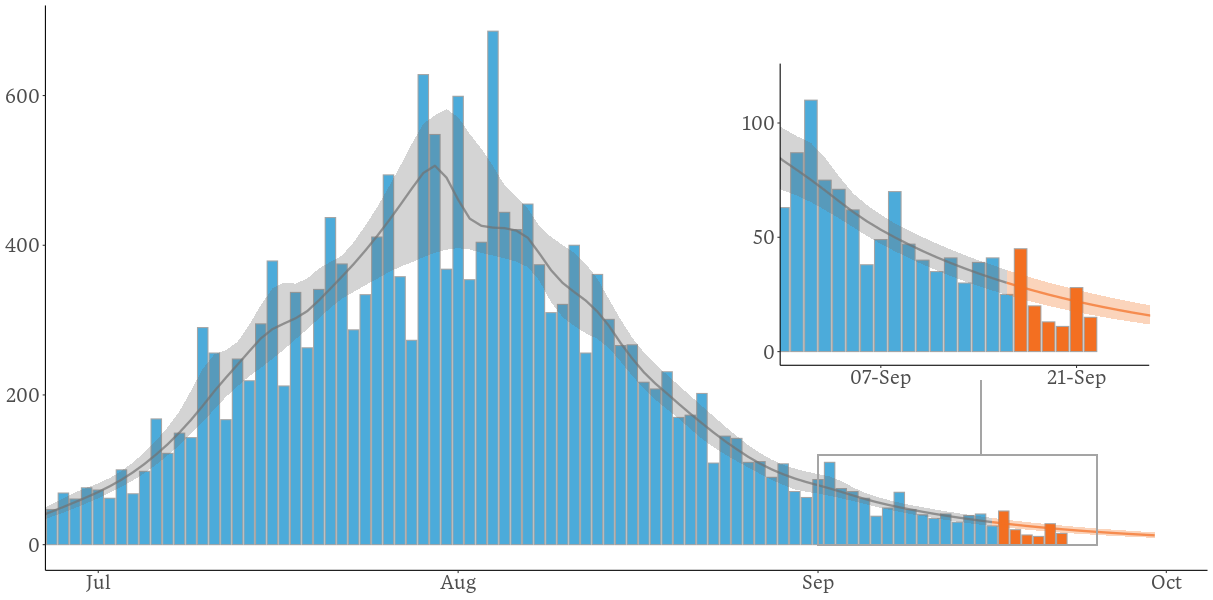
Actual and modelled daily reported cases of COVID-19 in Victoria
A bit more on how we did it
The methodology outlined in the paper Inferring change points in the spread of COVID-19 reveals the effectiveness of interventions combines a standard epidemiological model of disease (the SIR model) and a list of intervention dates that result in changes in underlying epidemiological parameters change. The researchers used a Markov Chain Monte Carlo method to estimate various model parameters at different points in time, and the uncertainty in these estimates. We have replicated this work for Victorian data.
We have assumed an approximately eight-day delay between infection and identification. This consists of the total time of incubation period, onset of COVID symptoms sufficient to warrant a test, and getting and receiving test results. Roughly speaking, this means we assume cases notified today relate to infections that took place, on average, eight days ago. Since the modelling approach uses simulations, a range of delays, centred on eight days, are used in practice.
Related articles
Related articles
More articles

Increase in Australians with disability – new ABS survey
New data shows a significant rise in the number of people who report having a disability. We discuss the findings and offer key takeaways
Read Article

What climate disclosure means for the public sector
Following up our article on climate disclosures for insurers, we look at the latest developments for government entities across Australia
Read Article